FinDeR Summer School (Part II): 3D point cloud classification using graph neural networks
The second part of my summer school experiments were done on my own just for fun and to see what worked/did not work outside of the given challenge problems.
Motivation
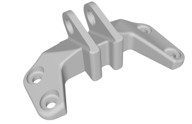
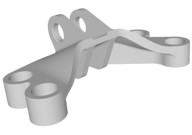
While I wanted to explore 3D data, I was also curious about how graph neural networks work and can apply in a design context, leading me to the Point Cloud Classification tutorial in PyTorch Geometric. I decided to use the SimJEB dataset, which consists of 382 jet engine bracket 3D models to test this out, though I was unsure if this would be enough data for a graph neural network.
Data
Each bracket, excluding those categories labeled as “other,” was converted to a point cloud using the open3d library and 2000 points sampled from the .obj file. The dataset was formatted to PyTorch Geometric data by recording the point positions and the associated bracket category to be used later for testing.
Graph Neural Network
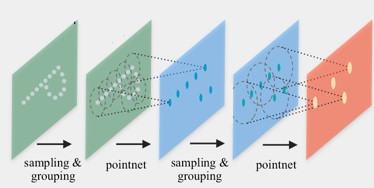
The GNN was taken with almost no modification from the Point Cloud Classification tutorial from PyTorch Geometric. PointNet++ implementation summarized from the tutorial:
- Group nodes using k-nearest neighbors as shown in the image above (or ball queries). In my case, I used k=20, somewhat arbitrarily.
- PointNet layers which use message passing based on the hidden features of the point at each layer and the point positions
- Downsampling to extract global features
The downsampling is used in a normal implementation but I didn’t include it in my initial exploration and instead used the basic version that had already been implemented.
The neural network’s architecture is as follows: 2 PointNet layers, which take the 3 input features and map to 32 features, followed by a linear classifier that classifies the output into 5 classes. More details are available in the original PointNet++ paper as well as the tutorial I followed.
Training
I shuffled the data and split it into approximately a 90/10 ratio for training and testing. I left the default learning rate of 0.01 for the Adam optimizer, the default loss as the Cross Entropy loss, as well as the default batch size of 10. I let the model train for 50 epochs initially, but after observing that the loss was still decreasing, I decided to increase the training to 200 epochs. The initial loss was 1.5779 and by epoch 200 it was 0.4869. However, at around epoch 193, the loss was at its lowest at 0.1033 before it started to increase again. I would have to look more closely at this behavior to understand the exact problem, but it seems there was overfitting.
Outcome
The final accuracy on the test set was 0.5263 and is visualized in the confusion matrix below. Obviously, this accuracy is not very good, though with 5 classes, it is better than random guessing. Additionally, the test set classes are a bit unbalanced, with only one test set example being the arch or butterfly bracket. This is in line with the dataset, which had fewer submitted designs of this type (as they tended to have lower mass but also lower strength). I will update this with the AUC metric instead of accuracy to address this point. However, the results were somewhat expected for several reasons:
- The PointNet++ implementation is not complete or tuned, having been taken directly from the tutorial.
- There are only hundreds of training examples instead of thousands or more.
- The labels in the dataset were determined qualitatively by the researchers who created the dataset. Unlikely common objects like chairs or tables in ShapeNet, there is actually no ground truth for the “types” of brackets. Therefore, it is possible that a good PointNet++ embedding could result in classification that actually makes more sense based on visual similarity than the human categorization. In this case comparing to the human labels is not a good accuracy measure.
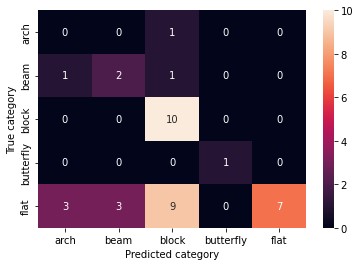
I looked at the confusion matrix more closely to try to understand what the issues might be before thinking about making any changes to the network’s architecture or trying a different approach altogether. There were a couple of things to note just based on the matrix:
- The block designs were categorized well, as was the single butterfly design.
- The flat designs were not terribly categorized, though they were often mistaken for a block design and in rarer cases, an arch or beam design.
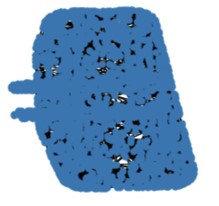
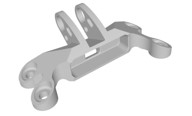
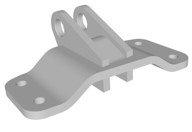
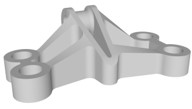
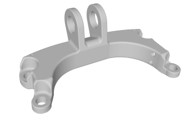
Visual inspection showed why some brackets may not have been categorized correctly, pointing towards problems when the ground truth is unknown. Below is the example of the bracket in the test set that had a true label as an arch, but was categorized as a block.
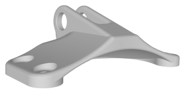
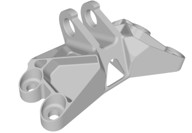
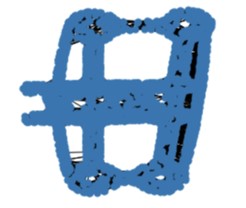
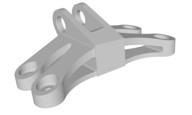
Another example is several brackets that had true labels as flat, but were categorized as something else.
Clearly, it is difficult to distinguish the features that put a bracket in one category over another. If an unsupervised approach was taken and the brackets were clustered instead, maybe different categories would have resulted. Furthermore, it is possible that a human might agree with the results of the classifier if there are enough common features with the rest of the category that can be found by eye. Another future approach to explore for this type of data is semi-supervised learning.
Lessons learned
This example from engineering design was particularly interesting because I would say the classifier appeared to work relatively fine given that the “true” labels were actually quite uncertain. In addition, I did not change the neural net’s architecture or hyperparameters so it is possible that things could be improved in that way. Of course, there is a lot left to be learned about different types of neural networks or other methods of learning a compact representation of 3D models (maybe, PointNet++ is not the best for the amount of data and the diversity in the global shape of the meshes). However, finding something that better represents this type of design-specific dataset could be useful, for example, to understand visual similarity of forms.